Bloomberg Charts
overview
As a Data company, one of the key requirements is the ability to visualize datasets to uncover trends. The charting application on the Bloomberg terminal holds two spots in the 5 most used applications, the only ones used by every single subscriber. This initiative outlines a bottom up reimagining of both a universal charting application and the Terminal's data visualization framework.
problem statement
The defining feature of the Bloomberg Terminal is the wealth of access to millions of datasets. Can we help customers better utilize that data to create more, better quality charts, keeping them within the Bloomberg ecosystem as opposed to downloading the data into other visualization software packages?
My Role
Project Lead, responsible for leading research initiatives, interaction design, and project management. Primary product group included 2 product owners, 5 designers, 2 UX Researchers, and multiple engineering scrum teams. Required collaboration with multiple other product groups within the organization.
2020-Present
Publications
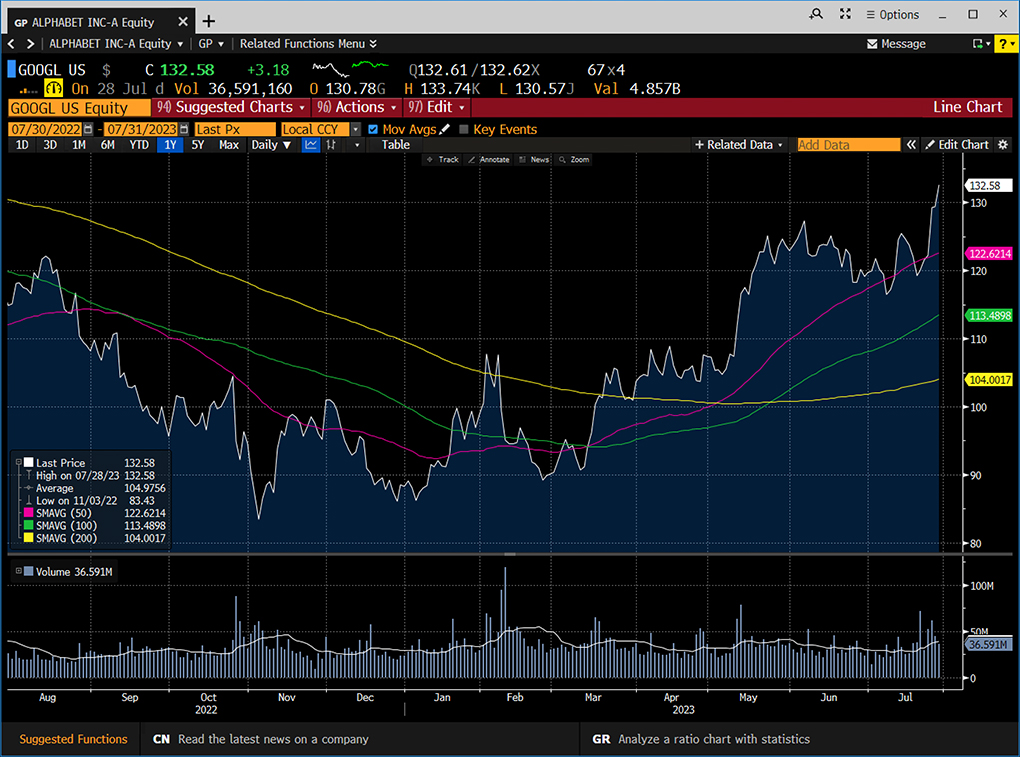
One of the many existing charting applications: GP (Graph Price).
Fill out the form below and I'll get back to you ASAP.